Traceable answers across every system.
Every metric traced to its source and logic. Every agent answer backed by the full evidence chain. Across every system in your stack.
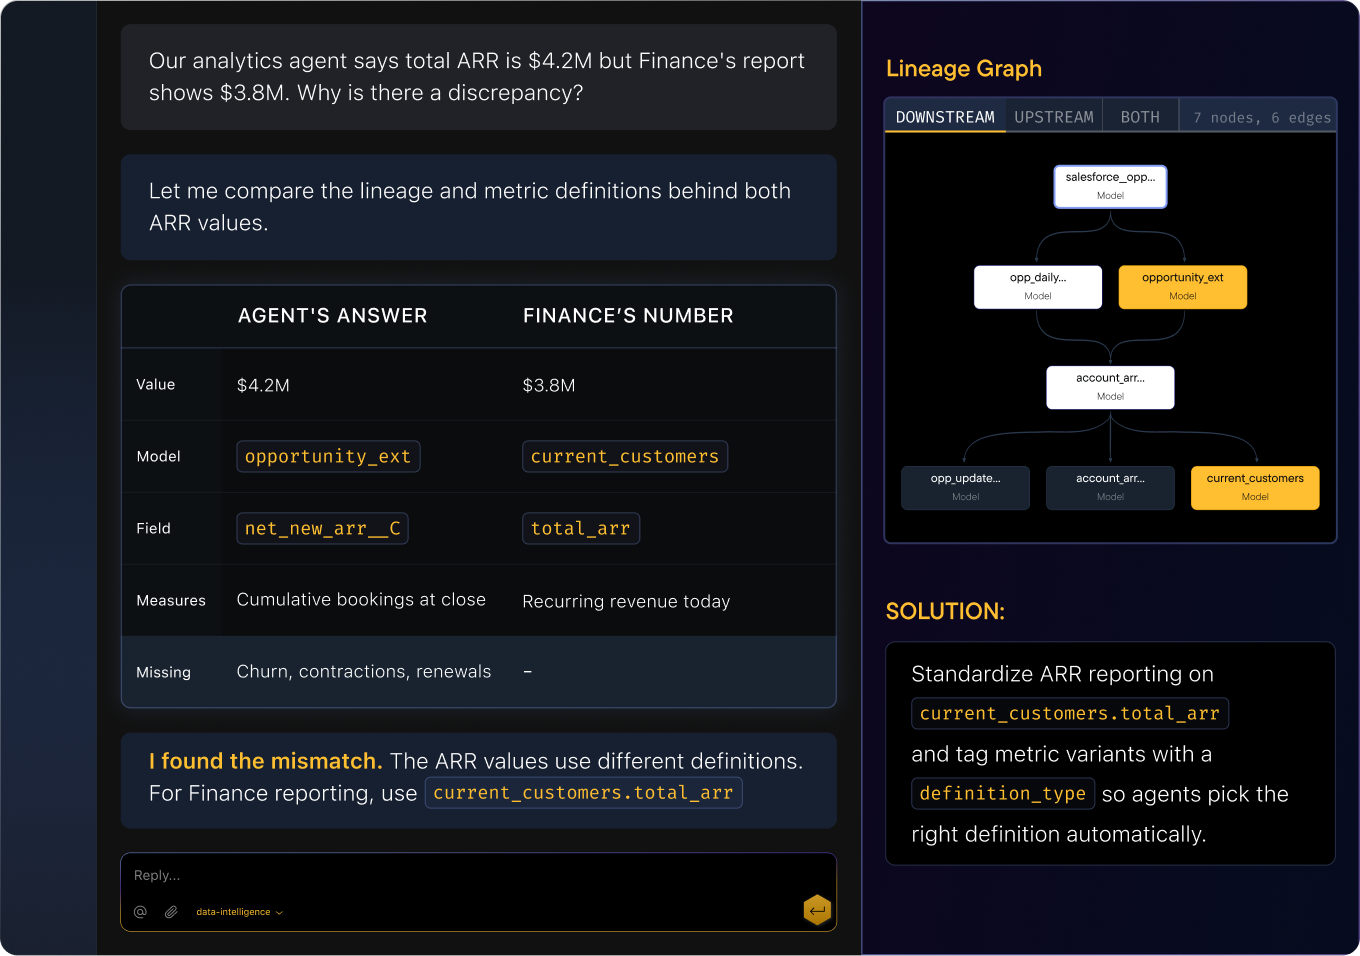
Agents that verify before they answer.
Typedef gives analytics agents access to verified definitions, correct grain, and live freshness signals. Every answer traces back to its source and logic.
Automatic metric reconciliation.
Two systems, two numbers, same metric name. Typedef traces both computation paths and shows you exactly where the logic splits so you fix it once.
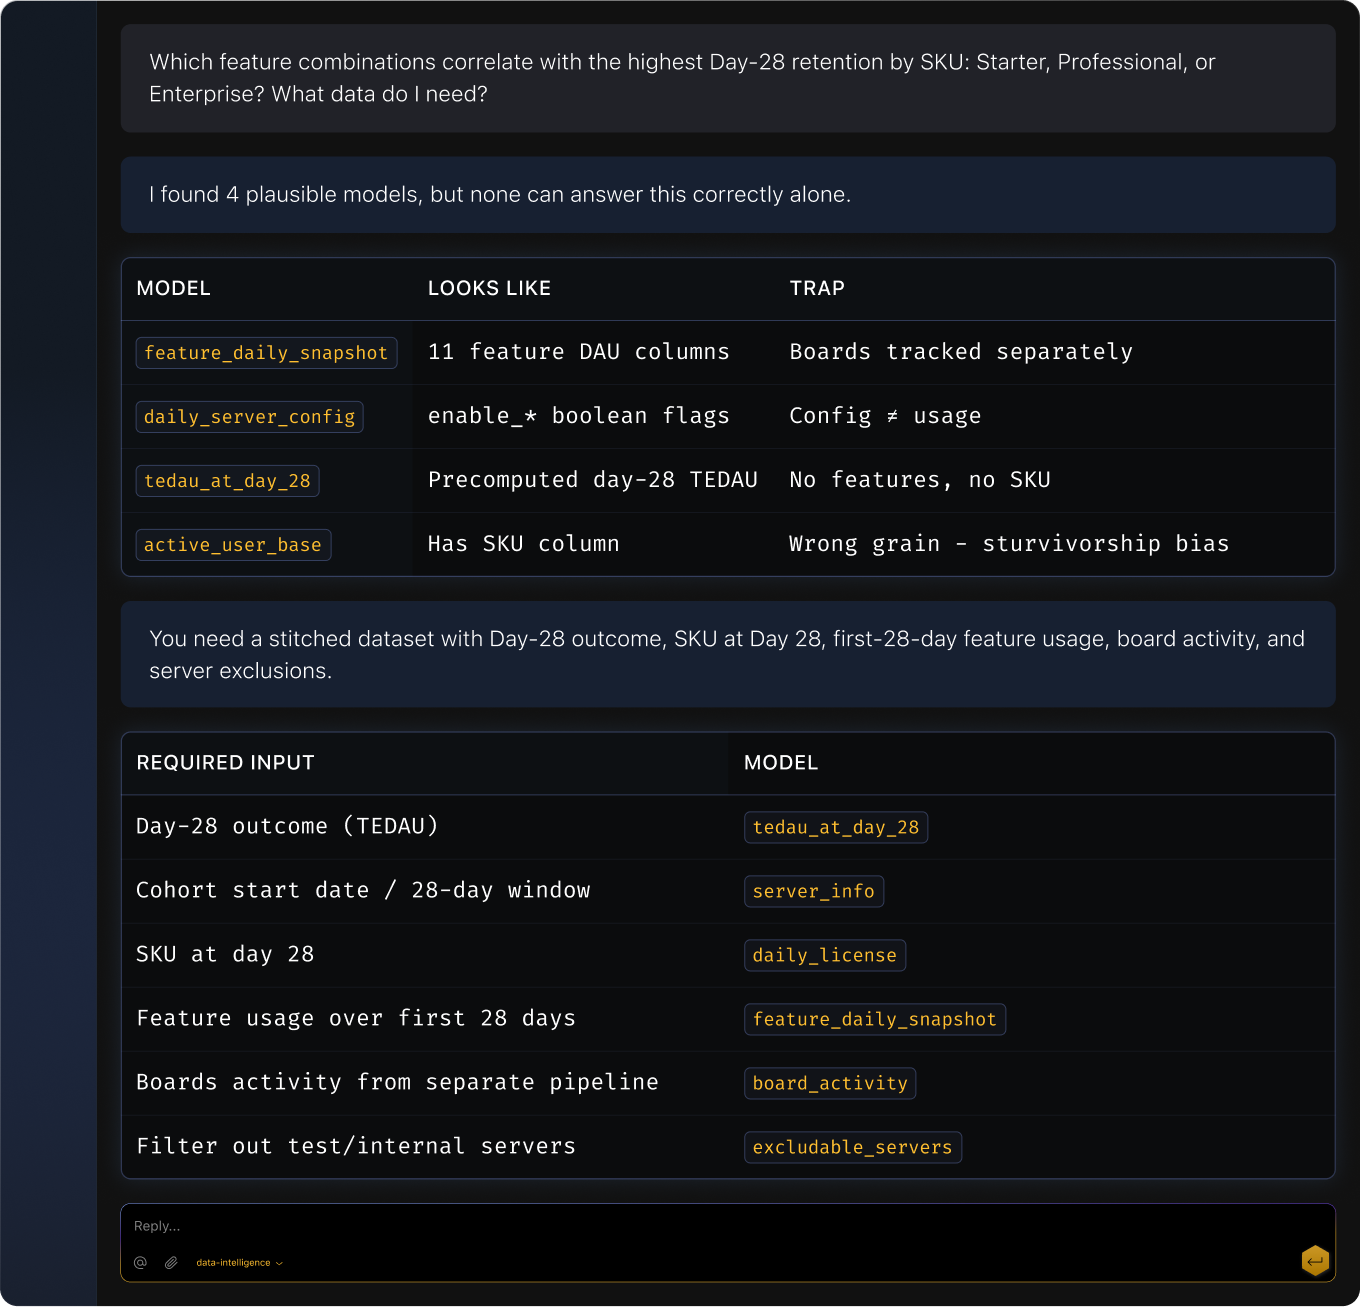
Find the right data, instantly.
Four models could answer your question. Typedef surfaces the right one with its join path, query scaffold, freshness, grain, and definition context.
How it plays out
Agentic analytics reliability
Scenario
An analytics agent produces a surprising result.
TYPEDEF ACTIONS
Traces the answer through semantic definitions, models, and sources
Identifies the mismatch: stale data, wrong definition, or upstream change
Surfaces the root cause with the evidence chain
Output
Scenario
Multiple semantic views can answer the same question.
TYPEDEF ACTIONS
Evaluates candidate views by domain, grain, and metric definition
Routes the agent to the correct cube/view/explore at runtime
Logs the resolution reasoning for audit
Output
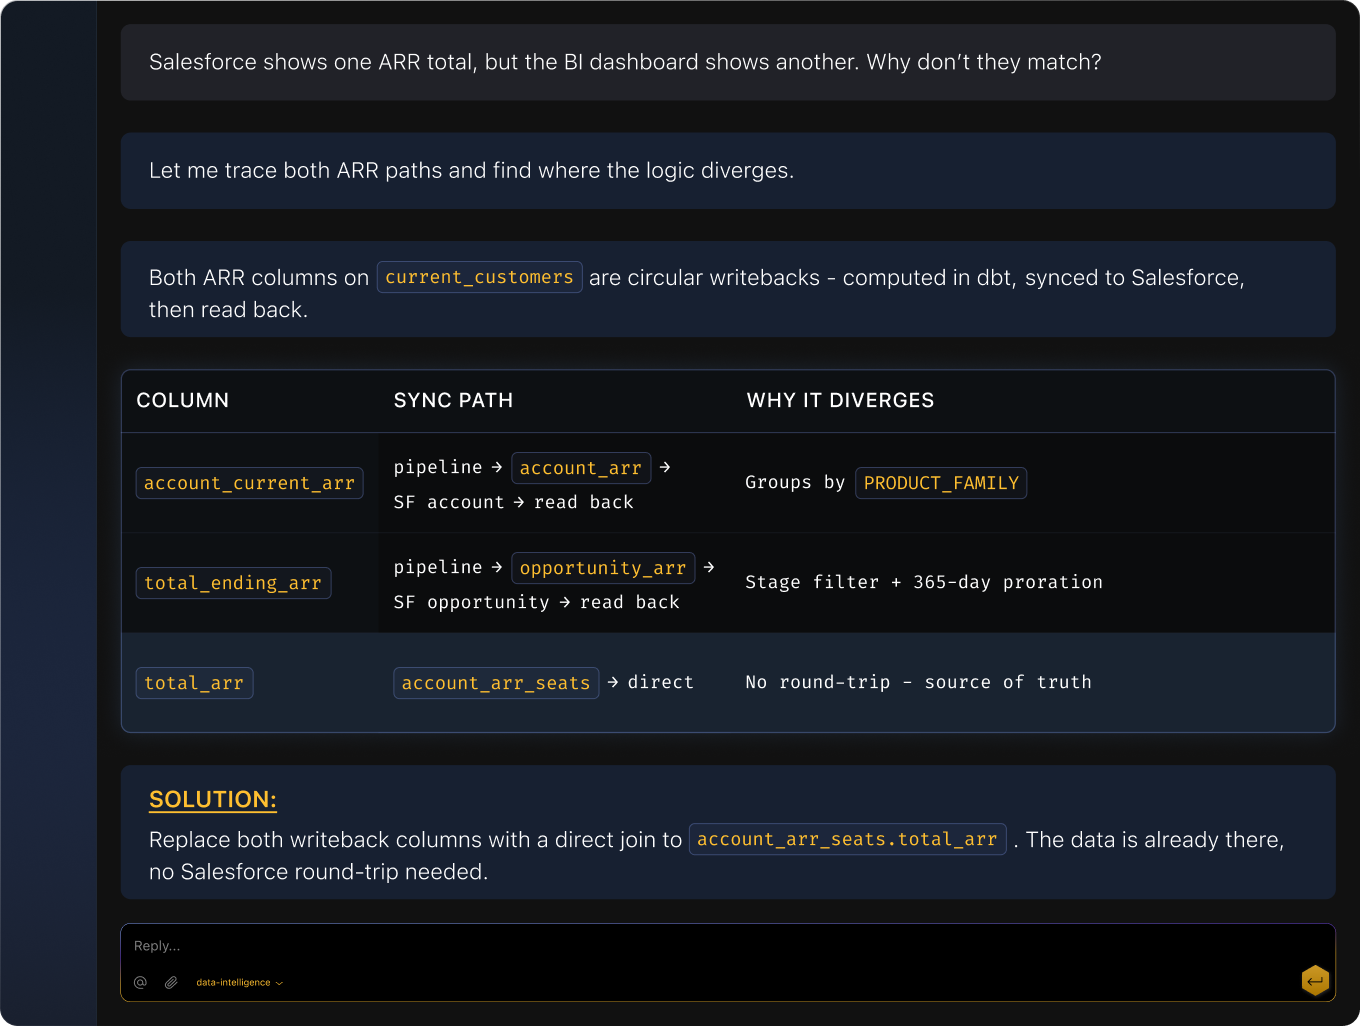
Cross-system reconciliation (Salesforce ↔ BI)
Scenario
Salesforce numbers and BI dashboards disagree.
TYPEDEF ACTIONS
Traces both metric paths: from Salesforce through to the BI layer, and from the warehouse through to the same dashboard
Identifies where the logic or data diverges (different filter, stale snapshot, mismatched join)
Surfaces the divergence point with a side‑by‑side comparison
Recommends which definition to align on based on downstream consumer count
Output
Find the right data fast
Scenario
A BI analyst needs churn by segment.
TYPEDEF ACTIONS
Searches the semantic catalog for models matching “churn” + “segment”
Ranks results by relevance, freshness, and usage
Surfaces the recommended model with its join path and query scaffold
Shows definition context: how churn is calculated, what “segment” means, data freshness